Tutorial
Understanding Releases and Provisional Data
Last Updated: Jan 14, 2025
What is a data release?
A NEON data Release is a fixed set of data that does not change over time. Each data product in a Release is associated with a unique Digital Object Identifier (DOI) that can be used for data citation. Because the data in a Release do not change, analyses performed on those data are traceable and reproducible.
NEON data are initially published under a Provisional status, meaning that data may be updated on an as-needed basis, without guarantee of reproducibility. Publishing Provisional data allows NEON to publish data rapidly while retaining the ability to make corrections or additions as they are identified.
After initial publication, a lag time occurs before the data are formally Released. During this lag time, extra quality control (QC) procedures, which are described in data product-specific documentation, may be performed. This lag time also ensures all data from laboratory analyses that complement existing field data are available before a data Release.
Although data within a Release do not change, NEON may discover errors or needed updates to data after the publication of a Release. For this reason, NEON generates a Release annually; each Release represents the best data available at the time of publication. Changes to data between Releases are documented on the web page for each Release and in the issue log for each data product.
Data citation
Each data product within a Release is associated with a DOI for reference and citation. DOI URLs will always resolve back to their corresponding data product Release’s landing webpage and are thus ideal for citing NEON data in publications and applications.
For more details about NEON data Releases, see the Data Product Revisions and Releases web page.
Objectives
After completing this activity, you will be able to:
- Download data from a specific NEON data Release
- Download Provisional NEON data
- Use appropriate citation information for both Released and Provisional data
Things You’ll Need To Complete This Tutorial
Most of this tutorial can be completed with nothing but an internet browser, without writing any code. You can learn about Releases and Provisional data and explore them on the Data Portal, and view figures from the data downloads.
To complete the full tutorial, including the coding sections, you will need a version of R (4.0 or higher) and, preferably, RStudio loaded on your computer. This code may work with earlier versions but it hasn't been tested.
Install R Packages
-
neonUtilities:
install.packages("neonUtilities")
Additional Resources
- NEON
- NEON Code Hub
Set Up R Environment
First install and load the necessary packages.
# install packages. can skip this step if

# the packages are already installed

install.packages("neonUtilities")


# load packages

library(neonUtilities)

library(ggplot2)


# set working directory

# modify for your computer

setwd("~/data")
Find data of interest
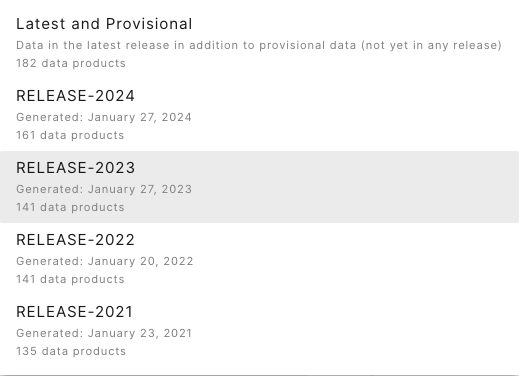
We'll start with the page on the NEON Data Portal, which has visual interfaces to allow you to select a particular Release, and show you which data are included in it.
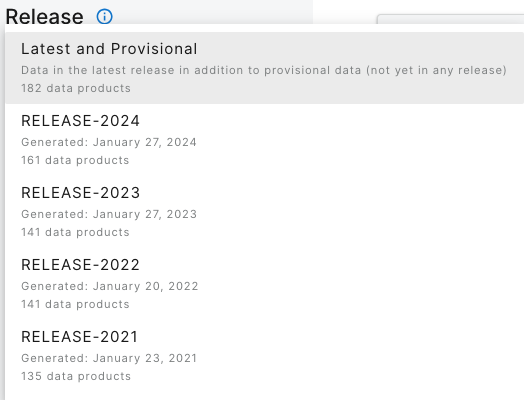
On the lefthand menu bar, the dropdown menu of Releases shows the available releases and the default display, which is the latest Release plus Provisional data.
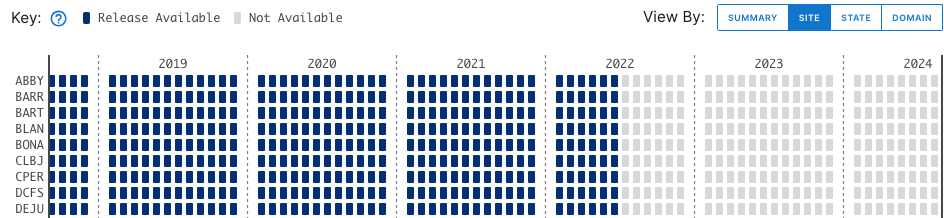
Stay on the default menu option for now. Navigate to quantum line PAR, DP1.00066.001. Expand the data availability chart by clicking on View By: SITE.
What you see will probably not look exactly like this, but similar. This is a screenshot from January 2024; more data and possibly more Releases may have been published by the time you follow this tutorial.
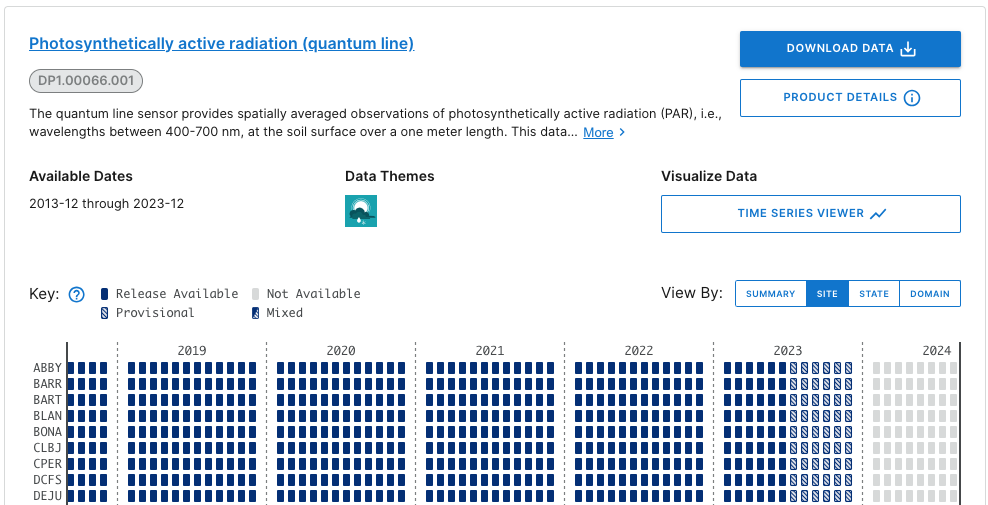
Here we can consult the key and see that data up to June 2023 are in a Release (solid boxes) and data collected since June 2023 are Provisional (hatched boxes). There are no 2024 data available yet (pale grey boxes).
Now click on the Product Details button to go to the web page.
This page contains details and documentation about the data product, including citation information for publications using these data.
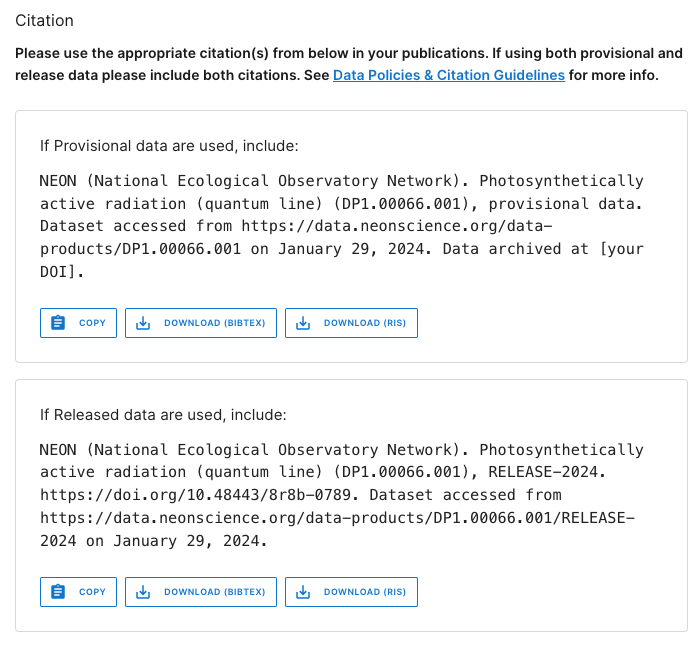
Note that the citation guidance is different for Provisional and Released data. The Release citation includes a direct link to a DOI. Since Provisional data are subject to change without notice, the data you download today may not exactly match data you download tomorrow. Because of this, the recommended workflow is to archive the version of Provisional data you used in your analyses, and provide a DOI to that archived version for citation. Guidance in doing this is available on the Publishing Research Outputs web page.
Downloading data
Latest and provisional
Go back to the main Explore Data Products page and click on Download Data. Select BARR (Utquiagvik) and BONA (Caribou Creek) for the year of 2023. Click Next.
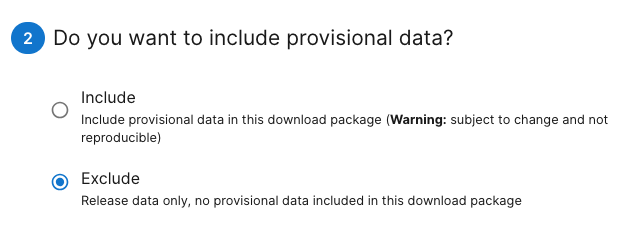
By default, the download options are set to access the latest Release and exclude Provisional data, even if they are available in the sites and dates you selected. To download Provisional data, select the radio button for Include in the interface.
Download by Release
But let's say you're not looking for the most recently updated data. You're replicating a colleague's analysis, and want to download the precise version of data they used. In that case, you need to download the Release they used.
Go back to the Explore Data Products page, and select the Release you need from the Release menu on the lefthand bar. For this example, let's use RELEASE-2023.
Now, in the data availability chart, we can see there are no hatched boxes, since we've selected only data that are in a Release. And data availability extends only through June 2022, the end date for sensor data in RELEASE-2023.
Downloading data using neonUtilities
NEON data can also be downloaded in R, using the neonUtilities package. If
you're not familiar with the neonUtilities package and how to use
it to access NEON data, we recommend you follow the Download and Explore NEON Data
tutorial as well as this one, for a more complete introduction.
Downloading the latest Release and Provisional
Let's download a full year of data for two sites, as we did on the Data Portal above. Here we'll download data from HEAL (Healy) and GUAN (Guanica), January 2023 - December 2023.
(Note: To see the code behavior below, if you are following this tutorial in 2025 or later, you may need to adjust the dates. In general, use the most recent full year of data.)
qpr <- loadByProduct(dpID="DP1.00066.001",
                     site=c("HEAL", "GUAN"),
                     startdate="2023-01",
                     enddate="2023-12",
                     check.size=F)
In the messages output as this function runs, you will see:
Provisional data were excluded from available files list. To download provisional data, use input parameter include.provisional=TRUE.
Just like on the Data Portal, you need to opt in to download Provisional data. We'll do that below. But first, let's take a look at the data we downloaded:
gg <- ggplot(qpr$PARQL_30min,
             aes(endDateTime, linePARMean)) +
  geom_line() +
  facet_wrap(~siteID)

gg
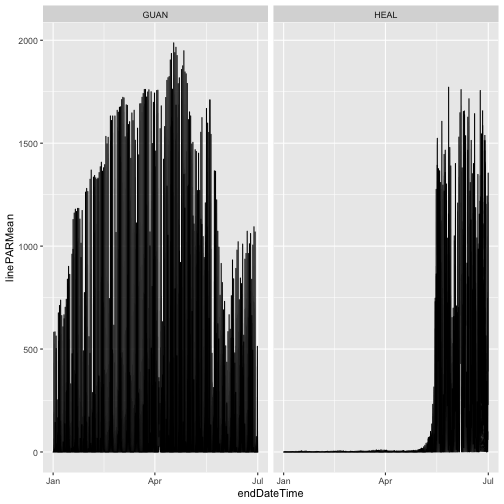
As we can see, the only data present from 2023 are from the first half of the year, the data included in RELEASE-2024. Provisional data from July 2023 onward were omitted.
Now let's download the Provisional data as well:
qpr <- loadByProduct(dpID="DP1.00066.001",
                     site=c("HEAL", "GUAN"),
                     startdate="2023-01",
                     enddate="2023-12",
                     include.provisional=T,
                     check.size=F)
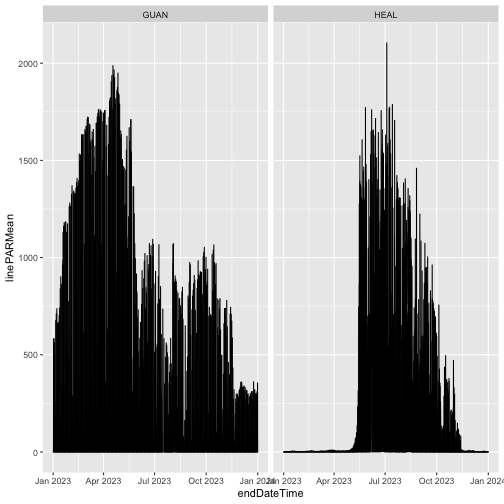
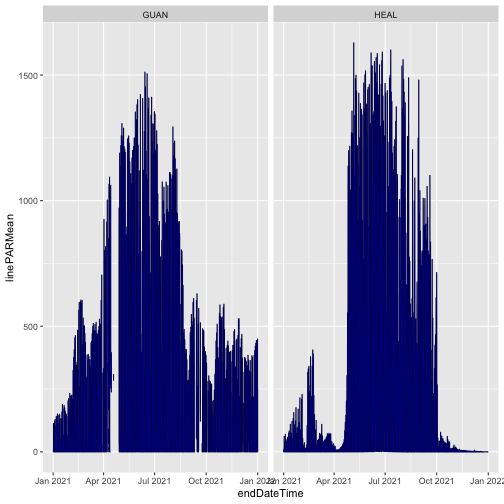
And now plot the full year of data:
gg <- ggplot(qpr$PARQL_30min,
             aes(endDateTime, linePARMean)) +
  geom_line() +
  facet_wrap(~siteID)

gg
Downloading by Release
To download a specific Release, add the input parameter release=.
Let's download the data from collection year 2021 in RELEASE-2023.
qpr23 <- loadByProduct(dpID="DP1.00066.001",
                     site=c("HEAL", "GUAN"),
                     startdate="2021-01",
                     enddate="2021-12",
                     release="RELEASE-2023",
                     check.size=F)
What types of differences might there be in data from different Releases? Let's look at the same data set in RELEASE-2024.
qpr24 <- loadByProduct(dpID="DP1.00066.001",
                     site=c("HEAL", "GUAN"),
                     startdate="2021-01",
                     enddate="2021-12",
                     release="RELEASE-2024",
                     check.size=F)
Plot mean PAR from each release. This time we'll only use data from soil plot 001, to simplify the figure. We'll plot RELEASE-2023 in black and RELEASE-2024 in partially transparent blue, to see differences where they're overlaid.
gg <- ggplot(qpr23$PARQL_30min
             [which(qpr23$PARQL_30min$horizontalPosition=="001"),],
             aes(endDateTime, linePARMean)) +
  geom_line() +
  facet_wrap(~siteID) +
  geom_line(data=qpr24$PARQL_30min
            [which(qpr24$PARQL_30min$horizontalPosition=="001"),],
            color="blue", alpha=0.3)

gg
The blue and black lines are basically identical; the mean PAR data have not changed between the two releases. We can consult the issue log to see if there are any changes recorded for other variables in the data.
tail(qpr24$issueLog_00066)
## id parentIssueID issueDate resolvedDate dateRangeStart
## <int> <int> <char> <char> <char>
## 1: 45613 NA 2022-01-18T00:00:00Z 2022-01-01T00:00:00Z 2013-01-01T00:00:00Z
## 2: 60104 NA 2022-07-05T00:00:00Z 2022-10-19T00:00:00Z 2021-10-15T00:00:00Z
## 3: 66607 NA 2022-09-12T00:00:00Z 2022-10-31T00:00:00Z 2022-06-12T00:00:00Z
## 4: 78006 NA 2023-03-02T00:00:00Z 2023-11-03T00:00:00Z 2023-03-02T00:00:00Z
## 5: 78310 NA 2023-03-16T00:00:00Z 2023-03-31T00:00:00Z 2014-02-18T00:00:00Z
## 6: 85004 NA 2024-01-04T00:00:00Z 2024-01-04T00:00:00Z 2013-12-01T00:00:00Z
## dateRangeEnd locationAffected
## <char> <char>
## 1: 2021-10-01T00:00:00Z All
## 2: 2022-10-19T00:00:00Z WREF soil plot 3 (HOR.VER: 003.000)
## 3: 2022-10-31T00:00:00Z YELL
## 4: 2023-11-03T00:00:00Z All
## 5: 2023-03-01T00:00:00Z All CPER soil plots (HOR: 001, 002, 003, 004, and 005)
## 6: 2023-12-31T00:00:00Z All terrestrial sites
## issue
## <char>
## 1: Data were reprocessed to incorporate minor and/or isolated corrections to quality control thresholds, sensor installation periods, geolocation data, and manual quality flags.
## 2: Sensor malfunction indicated by positive nighttime radiation
## 3: Severe flooding destroyed several roads into Yellowstone National Park in June 2022, making the YELL and BLDE sites inaccessible to NEON staff. Preventive and corrective maintenance were not able to be performed, nor was the annual exchange of sensors for calibration and validation. While automated quality control routines are likely to detect and flag most issues, users are advised to review data carefully.
## 4: Photosynthetically active radiation (quantum line) measurement height (zOffset) incorrectly shown as 0 m in the sensor positions file in the download package. The actual measurement height is 3+ cm above the soil surface.
## 5: Two different soil plot reference corner records were created for each CPER soil plot, which resulted in two partially different sets of sensor location data being reported in the sensor_positions file. Affected variables were referenceLatitude, referenceLongitude, referenceElevation, eastOffset, northOffset, xAzimuth, and yAzimuth. Other sensor location metadata, including sensor height/depth (zOffset), were unaffected but were still reported twice for each sensor.
## 6: Photosynthetically active radiation (quantum line) (DP1.00066.001) has been reprocessed using NEON’s new instrument processing pipeline. Computation of skewness and kurtosis statistics has been updated in the new pipeline. Previously, these statistics were computed with the Apache Commons Mathematics Library, version 3.6.1, which uses special unbiased formulations and not those described in the Algorithm Theoretical Basis Document (ATBD), which cites the standard formulations. Differences in data values between previous and reprocessed data for the skewness statistic are typically < 1% for 30-min averages and < 10% for 1-min averages. Differences for the kurtosis statistic are much larger, as the previous version reported excess kurtosis which subtracts a value of three so that a normal distribution is equal to zero. Thus, new values for kurtosis are typically greater by 3 ± 1% for 30-min averages and 3 ± 10% for 1-min averages.
## resolution
## <char>
## 1: Reprocessed provisional data are available now. Reprocessed data previously included in RELEASE-2021 will become available when RELEASE-2022 is issued.
## 2: Data flagged and sensor cable replaced.
## 3: Normal operations resumed on October 31, 2022, when the National Park Service opened a newly constructed road from Gardiner, MT to Mammoth, WY with minimal restrictions. For more details about data impacts, see Data Notification /impact/observatory-blog/data-impacts-neons-yellowstone-sites-yell-blde-due-catastrophic-flooding-0
## 4: Measurement heights have been added and data republication has been requested, which should be completed within a few weeks. Heights will be available from July 2022 onwards once data republication is complete and will be available for all data once RELEASE-2024 data are published (expected January 2024). The issue will persist in RELEASE-2023 data and prior data releases.
## 5: The erroneous reference corner record was deleted and data were scheduled for republication. This issue will persist in data from June 2022 and earlier until the RELEASE-2024 data is published (approximately January 2024). It will also persist in RELEASE-2023 and earlier data releases.
## 6: All provisional data have been updated, and data for all time and all sites will be updated in RELEASE-2024 (expected to be issued in late January, 2024).
The final issue noted in the table was reported and resolved in January 2024. It tells us that the data were reprocessed for the 2024 Release, and the algorithms for the skewness and kurtosis statistics were updated. Let's take a look at the kurtosis statistics from the two Releases.
gg <- ggplot(qpr23$PARQL_30min
             [which(qpr23$PARQL_30min$horizontalPosition=="001"),],
             aes(endDateTime, linePARKurtosis)) +
  geom_line() +
  facet_wrap(~siteID) +
  geom_line(data=qpr24$PARQL_30min
            [which(qpr24$PARQL_30min$horizontalPosition=="001"),],
            color="blue", alpha=0.3)

gg
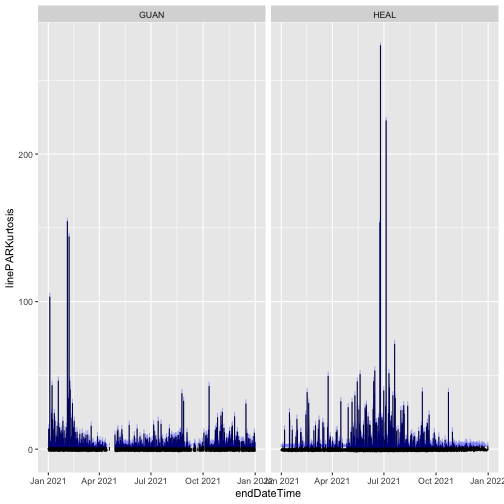
Here, we can see the kurtosis values have shifted slightly higher in RELEASE-2024, relative to their values in RELEASE-2023. This is a metric of the distribution of PAR observations within the averaging interval; if this aspect of variability is important for your analysis, you would now be able to incorporate these improved estimates into your work.
Data citation
We saw above that citation information is available on the data product detail
pages on the Data Portal. The neonUtilities package functions also provide
citations in BibTeX.
Provisional:
writeLines(qpr$citation_00066_PROVISIONAL)

## @misc{DP1.00066.001/provisional,
##   doi = {},
##   url = {https://data.neonscience.org/data-products/DP1.00066.001},
##   author = {{National Ecological Observatory Network (NEON)}},
##   language = {en},
##   title = {Photosynthetically active radiation (quantum line) (DP1.00066.001)},
##   publisher = {National Ecological Observatory Network (NEON)},
##   year = {2024}
## }
RELEASE-2024:
writeLines(qpr$`citation_00066_RELEASE-2024`)

## @misc{https://doi.org/10.48443/8r8b-0789,
##   doi = {10.48443/8R8B-0789},
##   url = {https://data.neonscience.org/data-products/DP1.00066.001/RELEASE-2024},
##   author = {{National Ecological Observatory Network (NEON)}},
##   keywords = {solar radiation, soil surface radiation, photosynthetically active radiation (PAR), photosynthetic photon flux density (PPFD), quantum line sensor},
##   language = {en},
##   title = {Photosynthetically active radiation (quantum line) (DP1.00066.001)},
##   publisher = {National Ecological Observatory Network (NEON)},
##   year = {2024},
##   copyright = {Creative Commons Zero v1.0 Universal}
## }
These can be adapted as needed for other formatting conventions.
Data management
Within the neonUtilities package, some functions download data, some
perform data wrangling on data you've already downloaded, and some do
both. Different approaches are practical for Released and Provisional
data.
Since data in a Release never change, there's no need to download a Release multiple times. On the other hand, if you're working with Provisional data, you may want to re-download each time you work on an analysis, to ensure you're always working with the most up-to-date data.
The neonUtilities cheat sheet includes an overview
of the operations carried out by each function, for reference.
Here, we'll outline some suggested workflows for data management, organized by NEON measurement system.
Sensor or observational (IS/OS)
Most people working with NEON's tabular data (OS and IS) use the
loadByProduct() function to download and stack data files. It
downloads data from the NEON API every time you run it. When
working with data in a Release, it can be convenient to save the
downloaded data as an R object and re-load it the next time you
work on your analysis, rather than downloading again.
tick <- loadByProduct(dpID="DP1.10093.001",
                     site=c("GUAN"),
                     release="RELEASE-2024",
                     check.size=F)


saveRDS(tick, paste0(getwd(), "/NEON_tick_data.rds"))
And the next time you start work:
tick <- readRDS(paste0(getwd(), "/NEON_tick_data.rds"))
When working with Provisional data, you can run
loadByProduct() every time to get the most recent data, but
be sure to save and archive the final version you use in a
publication, for citation and reproducibility. Guidelines for
archiving a dataset can be found on the
Publishing Research Outputs webpage.
Eddy covariance or atmospheric isotopes (SAE)
Because SAE files are so large, stackEddy() is designed to extract
the desired variables from locally stored files, and it works the
same way on files downloaded from the Data Portal or by
zipsByProduct(). You can download once, using your preferred method,
and then use stackEddy() every time you need to access any of the
file contents.
zipsByProduct(dpID="DP4.00200.001",
              site=c("TEAK"),
              startdate="2023-05",
              enddate="2023-06",
              release="RELEASE-2024",
              savepath=getwd(),
              check.size=F)


flux <- stackEddy(paste0(getwd(), "/filesToStack00200"),
                  level="dp04")
The next time you need to work with these data, you can skip the
zipsByProduct() line and go straight to stackEddy(). And if you
come back later and decide you want to work with the isotope data
instead of the flux data, still no need to re-download:
iso <- stackEddy(paste0(getwd(), "/filesToStack00200"),
                level="dp01", var="isoCo2", avg=6)
If you're working with Provisional SAE data, you may be thinking you'll need to re-download regularly. But SAE data are rarely re-processed outside of the annual release schedule, due to the large computational demands of SAE processing. Each month, you can download newly published Provisional data that were collected the previous month, but you won't need to re-download older months.
Remote sensing (AOP)
Data Releases are handled a bit differently for AOP than the other data systems. Due to the very large volume of data, past Releases of AOP data are not available for download. Only the most recent Release and Provisional data can be downloaded at any given time.
DOIs for past Releases of AOP data remain available, and can be used to cite the data in perpetuity. Their DOI status is set to "tombstone", the term used to denote a dataset that is citable but no longer accessible.
See the Large Data Packages section on the Publishing Research Outputs page for suggestions about archiving large datasets.